Earth: One Planet. No Undo Button.
A changing planet should be easier to see. Inside the Earth app: satellite maps, an interactive globe, image-age guides and exports for creative work.
We do not get a replacement planet
I spend much of my working life helping people decide what deserves attention in an image. Earth starts with a fairly large subject: the only place we know how to live.
Climate change is not an abstract interest for me. It is the context in which everything else happens. The work, the travel, the music, the ordinary expectation that a place will still be habitable and recognisable in a few decades. A beautiful image of the planet should make that relationship harder to forget.
I find it increasingly difficult to accept political decisions that treat more drilling and longer dependence on fossil fuels as common sense, while treating the consequences as someone else’s future problem. The profit arrives on one balance sheet. The heat, damaged ecosystems and costs of adaptation arrive everywhere else. The atmosphere is notoriously uninterested in quarterly earnings.
The science is not waiting for better branding. The IPCC’s synthesis of climate research identifies human activity, principally greenhouse-gas emissions, as the cause of global warming and explains why rapid, sustained emissions reductions matter. My opinion is that our political and creative attention should reflect the scale of that responsibility.
Earth is a small contribution from the tools I know: imagery, colour, systems and software. I want it to be easy to bring a changing view of our shared home into the places where people look.
A planet you can actually use
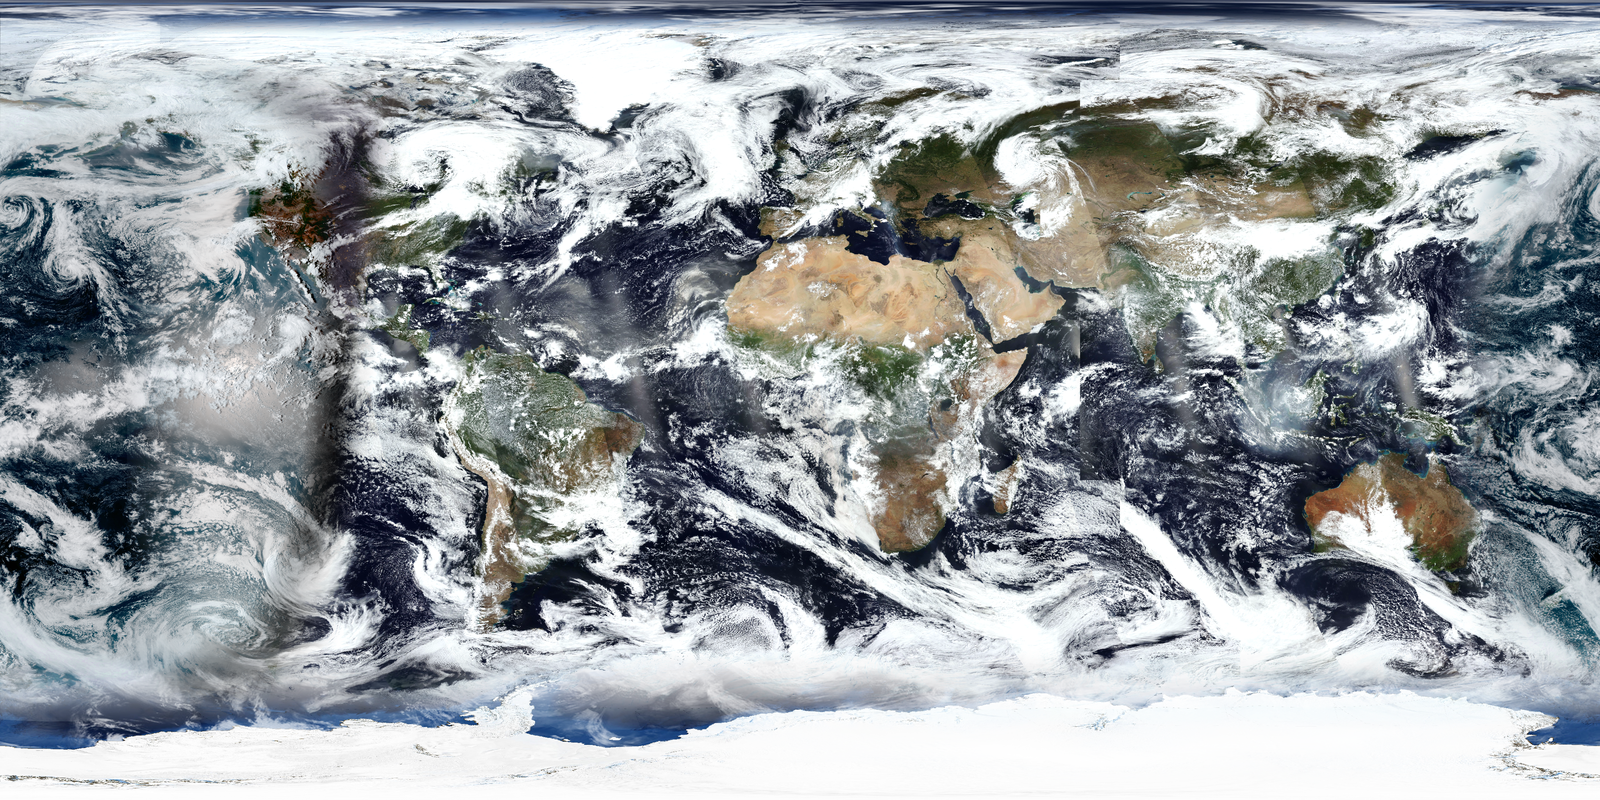
Earth builds a usable planet texture from satellite imagery. The browser app lets you inspect the flat map, spin a globe, choose sources and download a JPEG or PNG. An optional local API provides automatically refreshing images for creative software.
That could become a slowly changing backdrop in a gallery installation, a globe in a classroom, a museum display, a documentary graphic, or a desktop reminder that the weather outside belongs to a much larger system. A performance could use the image as material rather than stock decoration. An exhibition about climate could place it alongside properly sourced temperature or emissions records.
Those are different kinds of evidence. Today’s cloud pattern is weather. It cannot, by itself, establish a climate trend. Earth is a visual entry point, not a climate model, a sea-ice monitoring product or an emergency information service.
One image, two ways to look at it
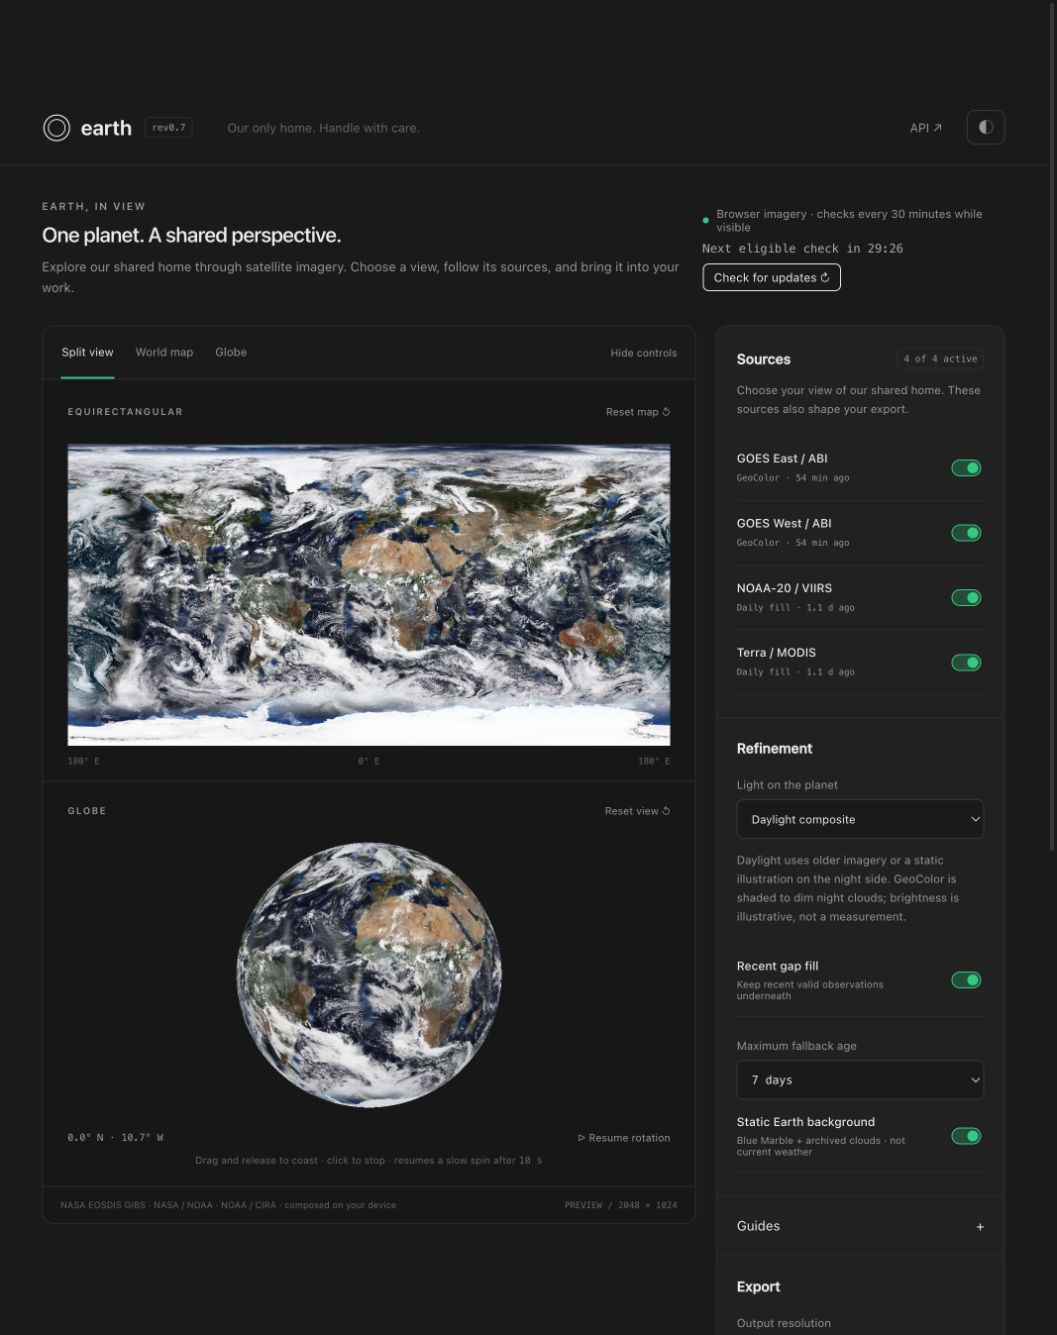
Split view shows the image as a two-to-one equirectangular map and wrapped around a sphere. The flat map makes coverage boundaries and the texture’s left/right join easier to inspect. The globe shows how those same pixels will read on a planet in a scene. Drag the map horizontally to pan, or drag the globe to rotate it; the rotation control lets you stop and inspect a particular region. The World map and Globe tabs give either view more room.
The Sources switches control which observations contribute to the composite and its export. The source timestamps distinguish recent GOES frames from older VIIRS and MODIS daily products. Those labels explain why the map can look complete without representing one instant everywhere.
Public science made portable
The imagery comes through NASA’s Global Imagery Browse Services, GIBS. The present implementation combines GOES East and West GeoColor imagery with daily NOAA-20 VIIRS and Terra MODIS products. NASA Blue Marble provides the static surface background, combined with its archived 2002 cloud composite. The GOES GeoColor contribution is credited to NOAA and CIRA; a NASA delivery service does not make every underlying product NASA-owned.
Worldview is a useful reference for discovering what GIBS offers. Earth is independently implemented against the documented services; it is not a fork of Worldview and does not incorporate its application code.
There is a distinction worth making about NASA’s changing website. Earthdata is consolidating NASA Earth-science sites, but a redesigned portal is not what invented this possibility. NASA was already documenting geostationary imagery in its 2019 Worldview guide. The important development is the availability of frequently updated imagery through documented, reusable services. That is what lets a small independent tool do useful work without scraping a website.
A complete picture, with honest gaps in time
A satellite mosaic is not one photograph taken everywhere at once. Different satellites cover different regions, at different times and viewing angles. Visible-light products have a night side. Daily products have swath boundaries. Polar coverage is a particular challenge.
A black wedge in a texture is an implementation problem for the artist using it. Pretending that every filled pixel is a fresh observation would be a different, more serious problem.
Earth combines selected observations with recent cached imagery and a static background underneath the remaining gaps. Recent gap fill keeps earlier valid observations available; Maximum fallback age limits that history to 24 hours, three days or seven days. It cannot recover an observation the browser has never cached. Static Earth background supplies Blue Marble geography, archived 2002 clouds and illustrative polar fill. Those areas are not current polar weather or sea ice.
Daylight composite uses fallback imagery where the GOES night side is masked. Day / night · shaded GeoColor dims the night side for presentation. That shading is illustrative, not a measurement of visible-light brightness. Neither mode creates a simultaneous photograph of the entire world.
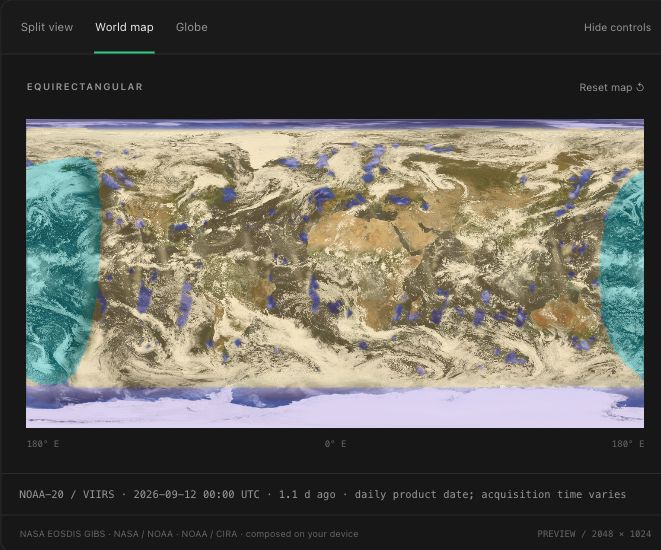
Open Guides and turn on Imagery age guide to see the dominant source at each location. Turquoise marks imagery under three hours old, yellow marks one-to-three-day-old observations, and purple marks static illustration. The legend also distinguishes intermediate and older age bands. Hover over the map or globe to inspect the contributing source and date. Feathered boundaries are approximate, and a daily product date does not mean every pixel was acquired at midnight.
The age colours and optional coordinate grid appear only in the previews; they are excluded from exports. The Map coverage figure also needs context: 100% includes enabled static background. It describes a filled image, not 100% fresh satellite coverage.
The goal is visual continuity and clear disclosure together. A static patch should never acquire a fresh timestamp just because the surrounding map was regenerated.
Why an API, rather than another walled garden
I work across applications. The planet should not need a different bespoke integration for each one.
An equirectangular image has a familiar two-to-one shape and maps naturally onto a sphere. JPEG and PNG can be consumed by an enormous range of software. The browser’s Export panel produces a file directly on your device. Choose a resolution and format, then select Download image. JPEG is smaller; PNG is lossless and can preserve transparent gaps when the static background is disabled. JPEG exports extend to 16K and PNG to 8K, but larger dimensions do not add satellite detail.
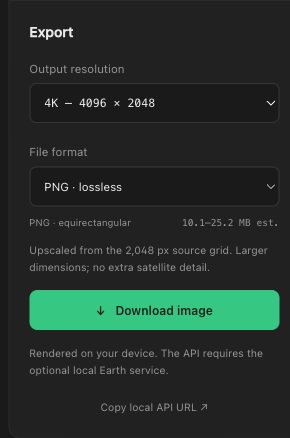
For a still graphic or a manually updated material, the downloaded file is enough. For an installation that needs to refresh automatically, run the optional local Earth service. Copy local API URL builds a request for http://127.0.0.1:8000; that address only works when the service is installed and running. There is no hosted image API behind the browser page. The local request lets the caller describe the view with a few choices:
http://127.0.0.1:8000/v1/image?width=4096&layers=modis,viirs,goes-west,goes-east&appearance=daylight&gap_fill=recent&max_age_hours=168&basemap=blue-marble&format=pngThe local service also exposes /v1/metadata for observation times and provenance, and /v1/latest/master for the default master image. Consumers can pin a generation when they need a repeatable output.
TouchDesigner can use a file bridge or an HTTP request that updates a texture. Blender can reload the resulting image into a material. Notch can reload it through a Dynamic Image Loader. The same pattern extends to Unity, Unreal Engine, a Three.js website, a projection-mapping system or a video-production workflow that reads a periodically refreshed image. These are integration patterns, not a claim that every application has the same native URL support.
The supplied bridge keeps a stable local file and retains the last valid image when a request fails. That matters in an installation: a network hiccup should not turn a planet into a missing-media warning.
Keep the infrastructure proportionate
The browser fetches imagery directly from NASA GIBS and composes it on the viewer’s device. It checks at most every 30 minutes while visible, shares its cache and request budget between tabs, and pauses checks when hidden. The optional local API uses a shared producer and cache for its consumers. Neither workflow needs a network request every animation frame.
Browser mode uses a 2048-pixel-wide source grid; the local API uses a 4096-pixel-wide grid. Their cached histories can differ, so their mosaics may differ too. Increasing export dimensions does not create additional satellite detail. GOES products can have a ten-minute cadence, but delivery, checking intervals and older fallback imagery all affect what appears in the finished map.
That is why the dates are part of the product, rather than a footnote hidden behind the picture.
Where it stands
Earth brings together a browser application for exploring and exporting imagery and an optional Python service for automatic updates in creative software. Installing the local service requires repository access or a source archive; a public installer is not yet available.
The reason for building it is already settled. We have one planet. Making it easier to see, understand and include in our work feels like a worthwhile use of these skills. It will not substitute for emissions cuts or political accountability. It can make the subject a little harder to push out of frame.
If you use the project and want to help keep it alive, buy me a coffee. That supports my work and the project’s running costs; it is separate from the IPCC and is not a climate-charity donation.