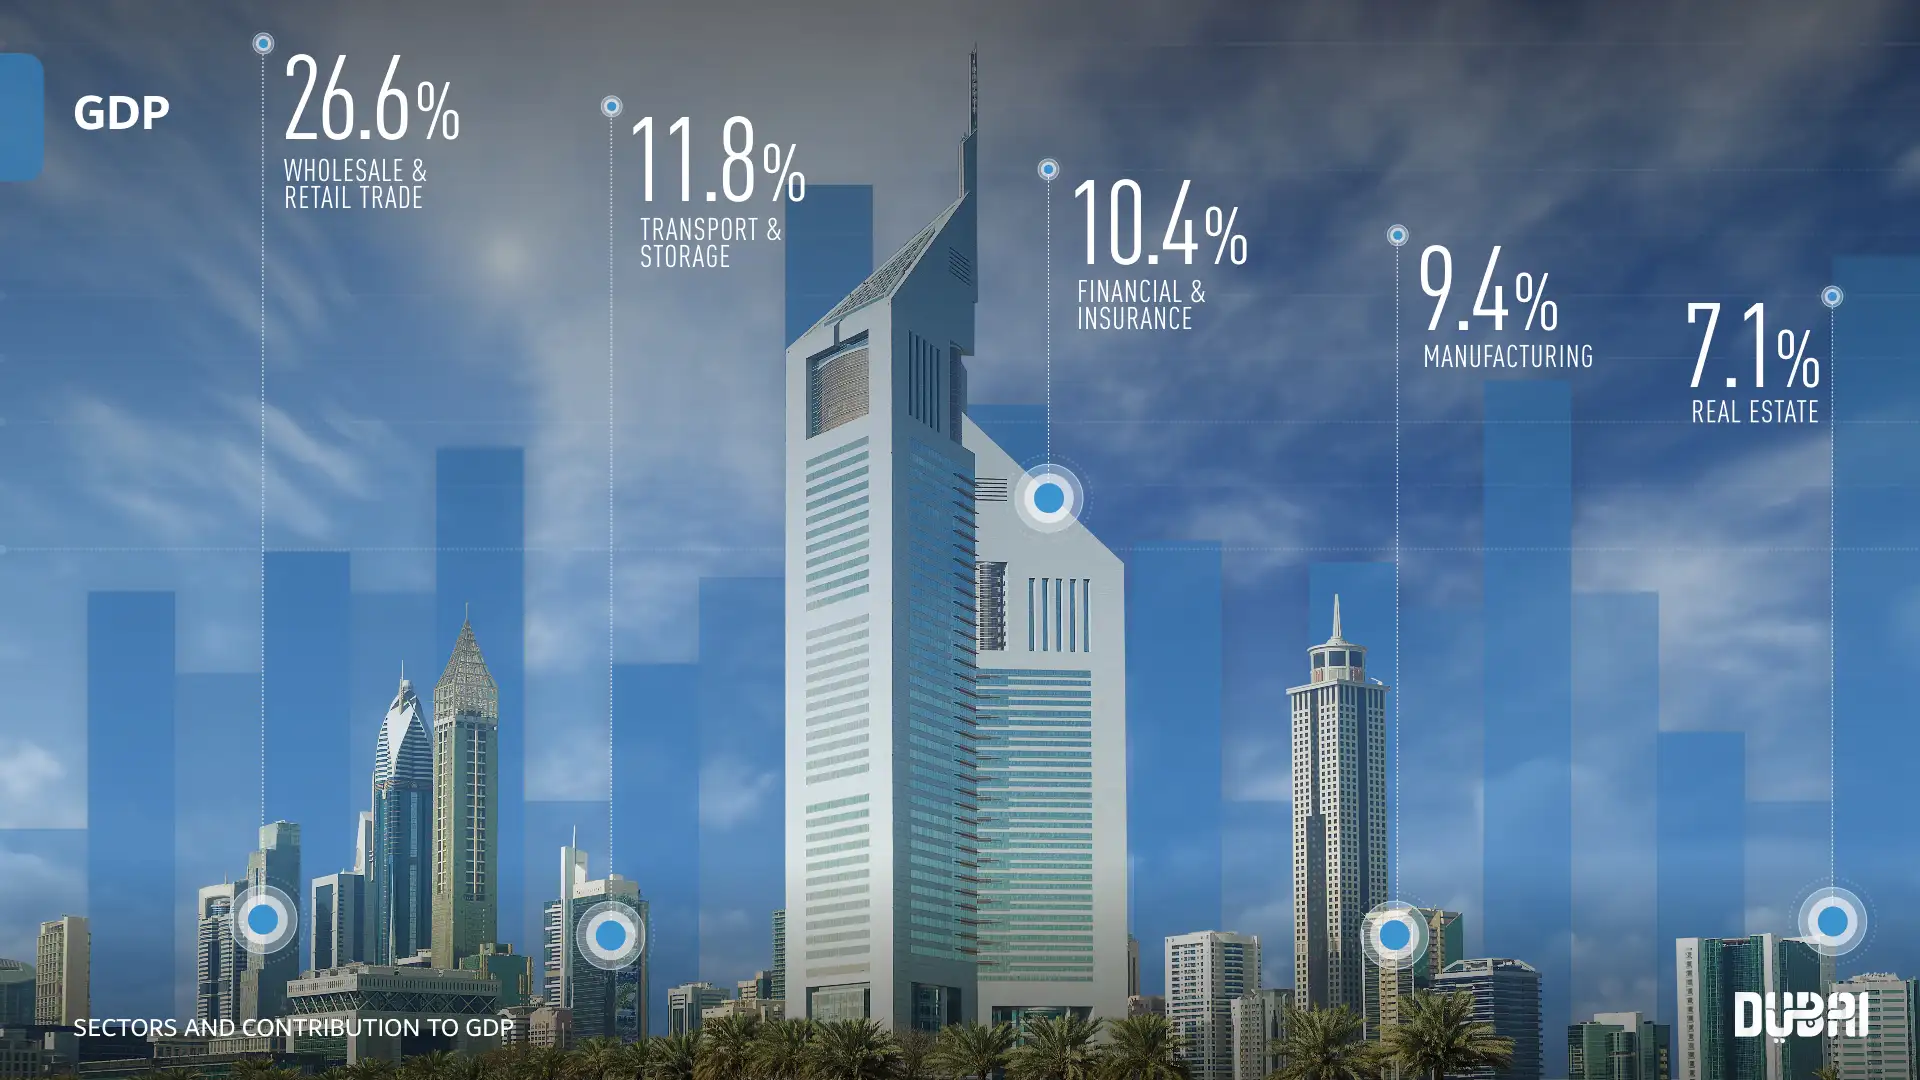
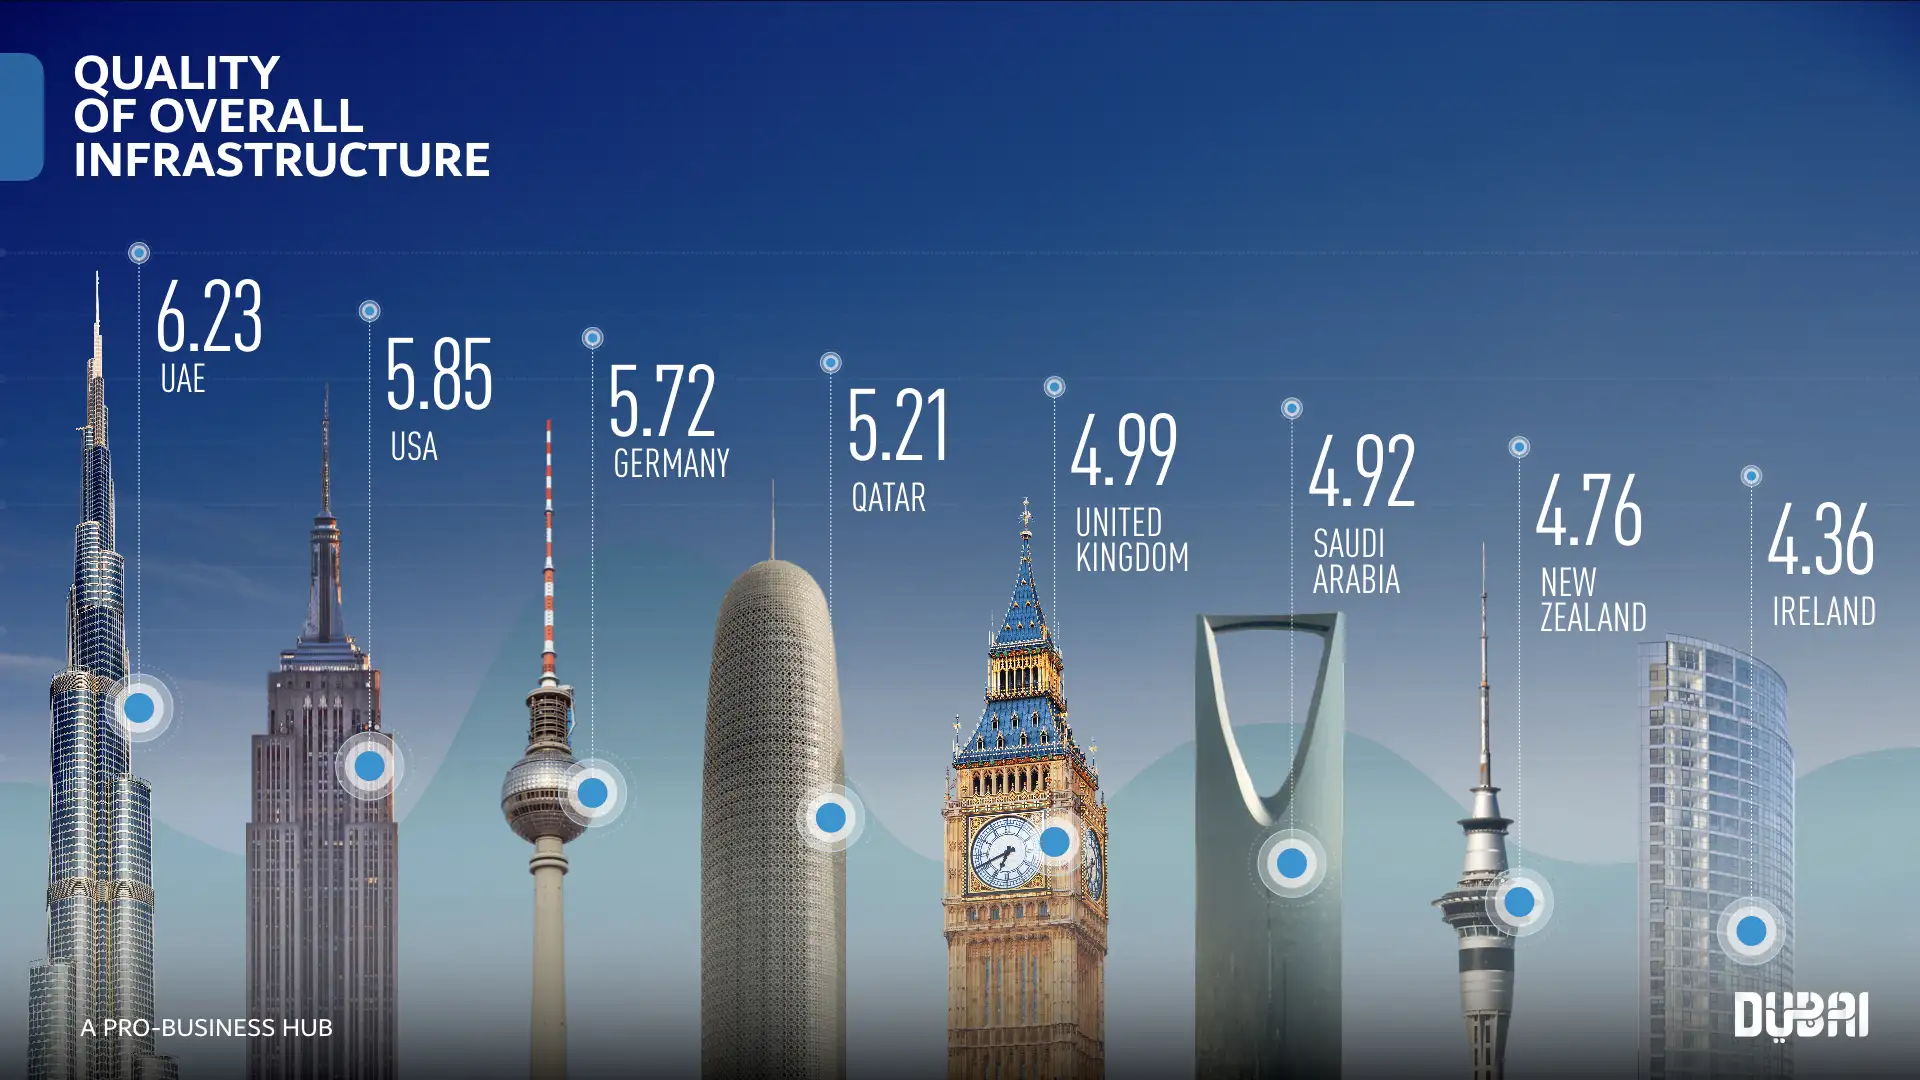
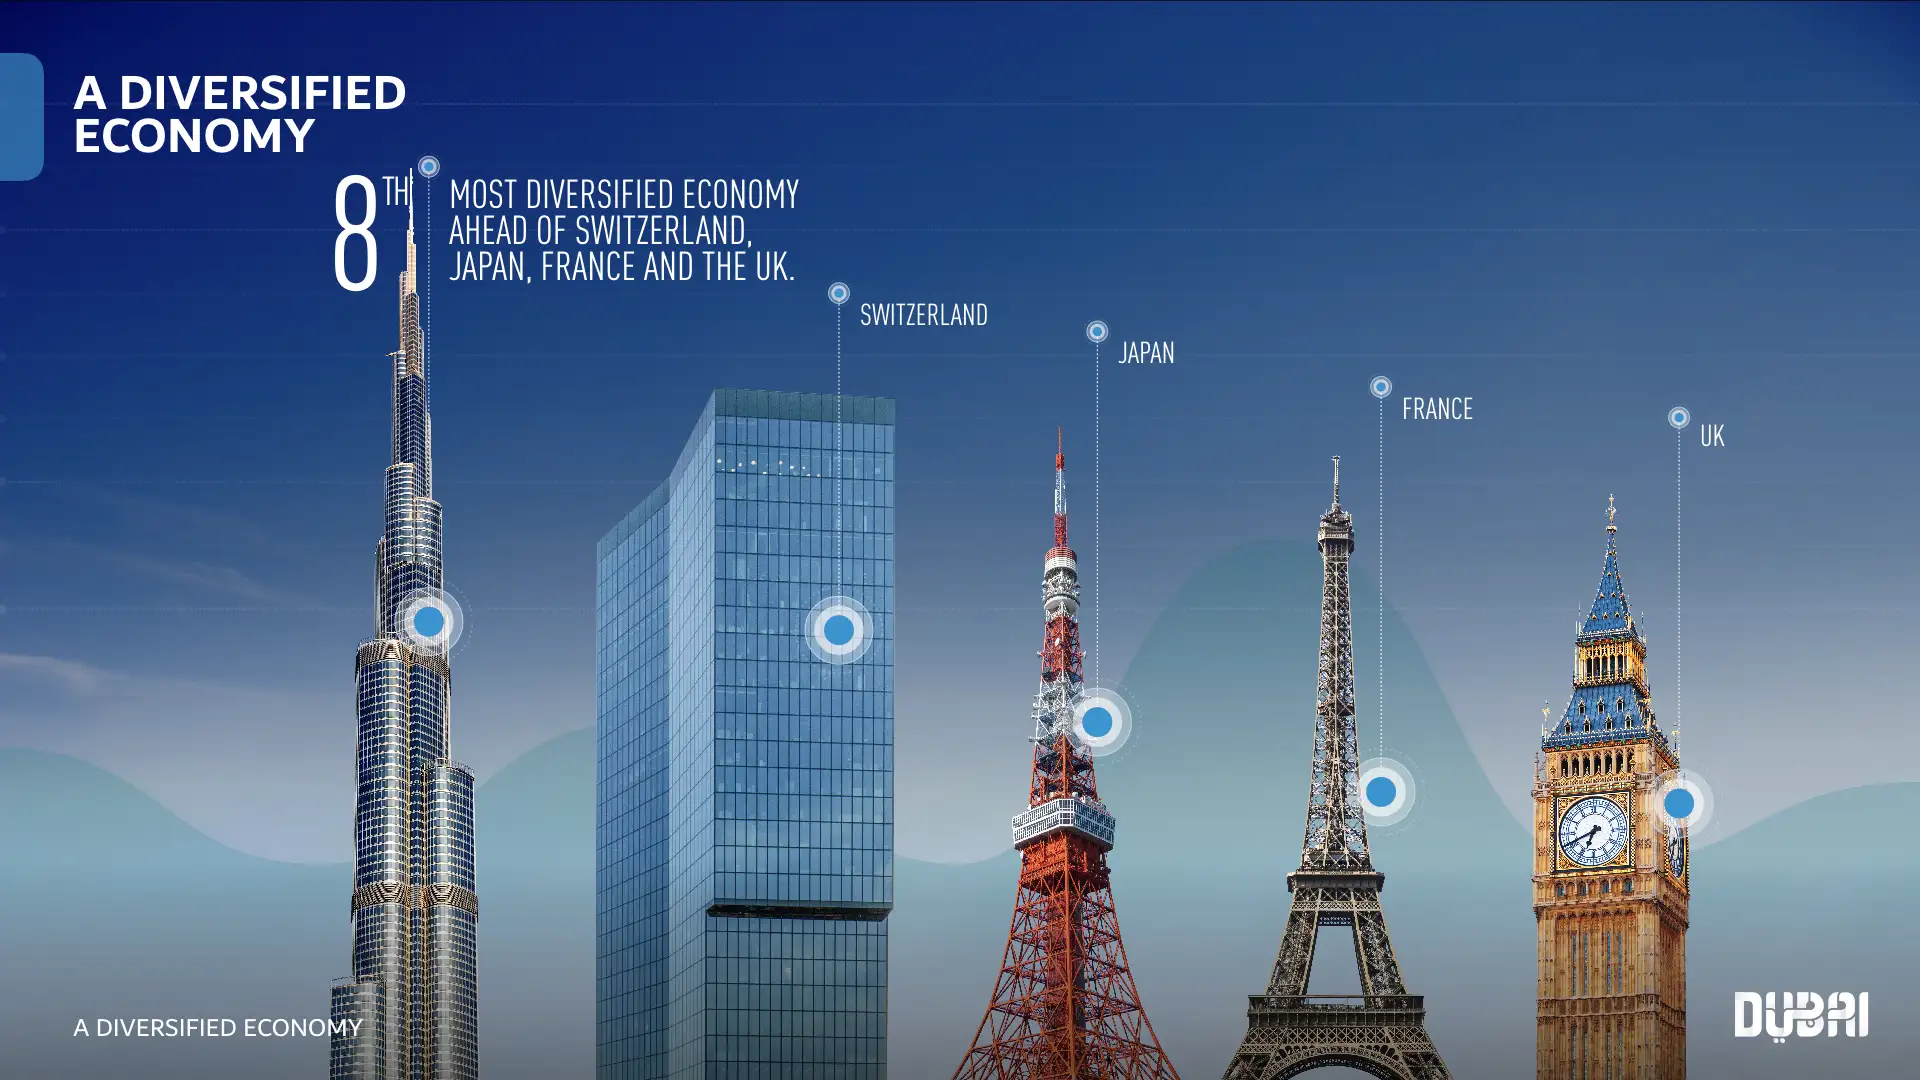
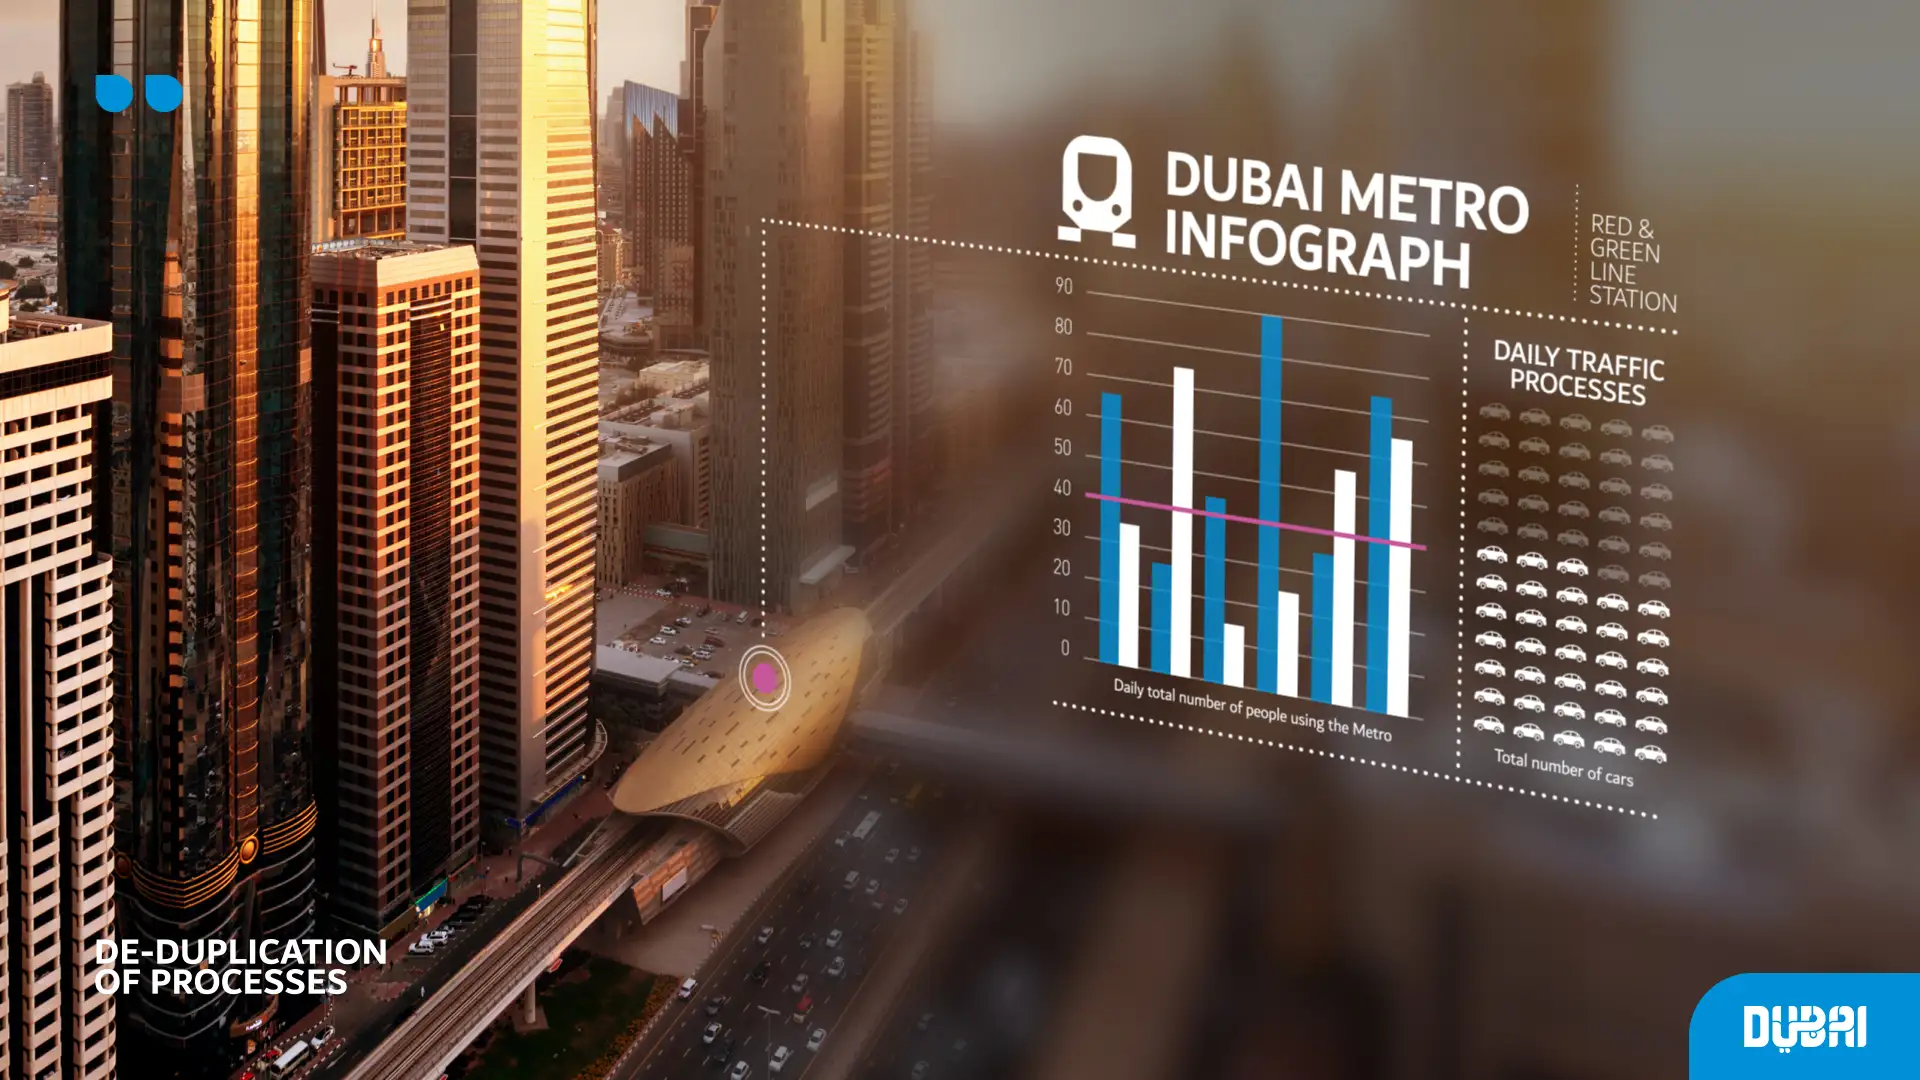
Data Visualization
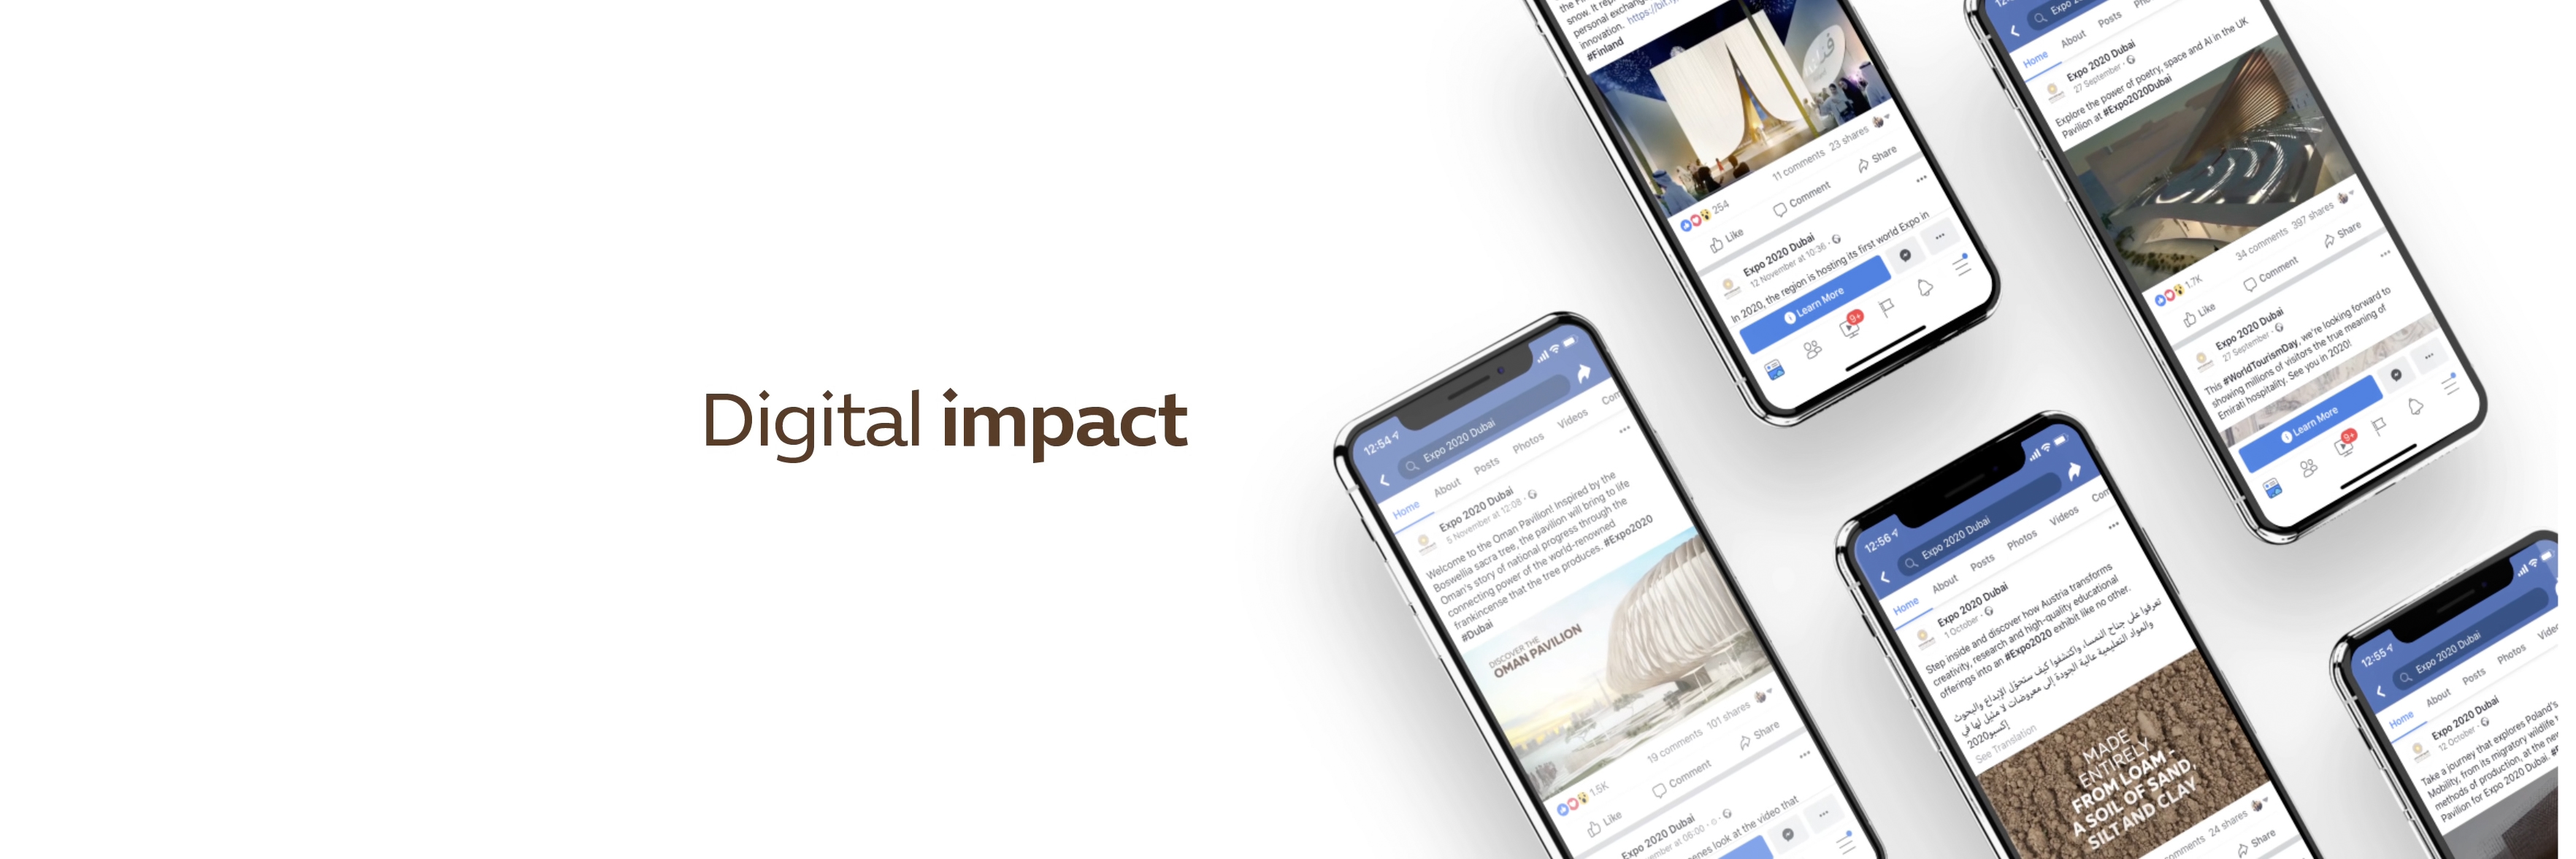
Drawing on my experience with complex clients such as Touchline Dubai, Expo 2020, and Dubai Tourism, I've honed my expertise in crafting impactful data visualizations, and I've developed a keen understanding of the intricacies of presenting complex information with clarity and precision.
My work goes beyond aesthetics, incorporating interactivity and editability to meet the diverse needs of clients.
By combining technology integration and real-time updates, I've successfully delivered visualizations that not only engage but also facilitate efficient data exploration.
Upholding ethical standards and ensuring accessibility, my approach to data visualization reflects a commitment to delivering insightful narratives that resonate with diverse audiences.
Skills
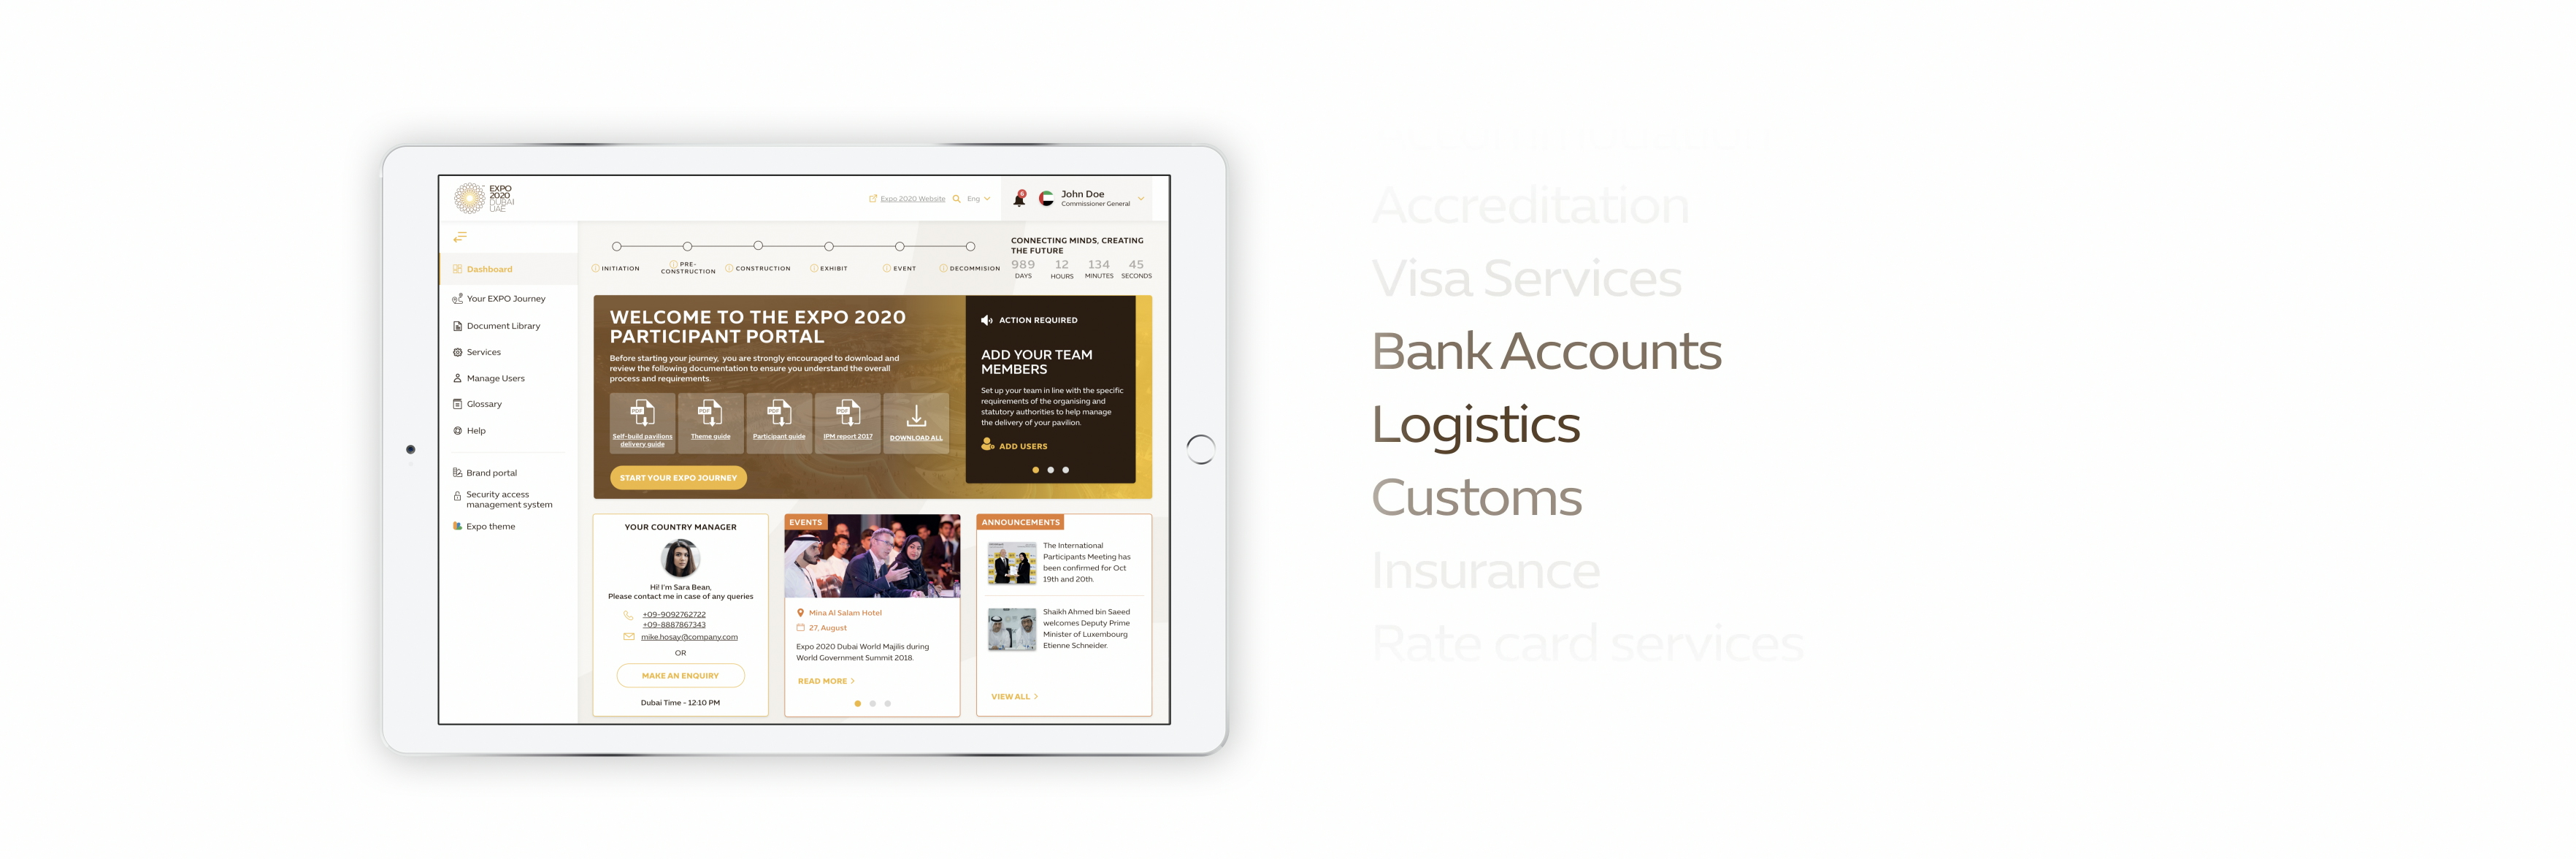
Data Discovery
Presentation Design
Dynamic Updates
Inclusive Design
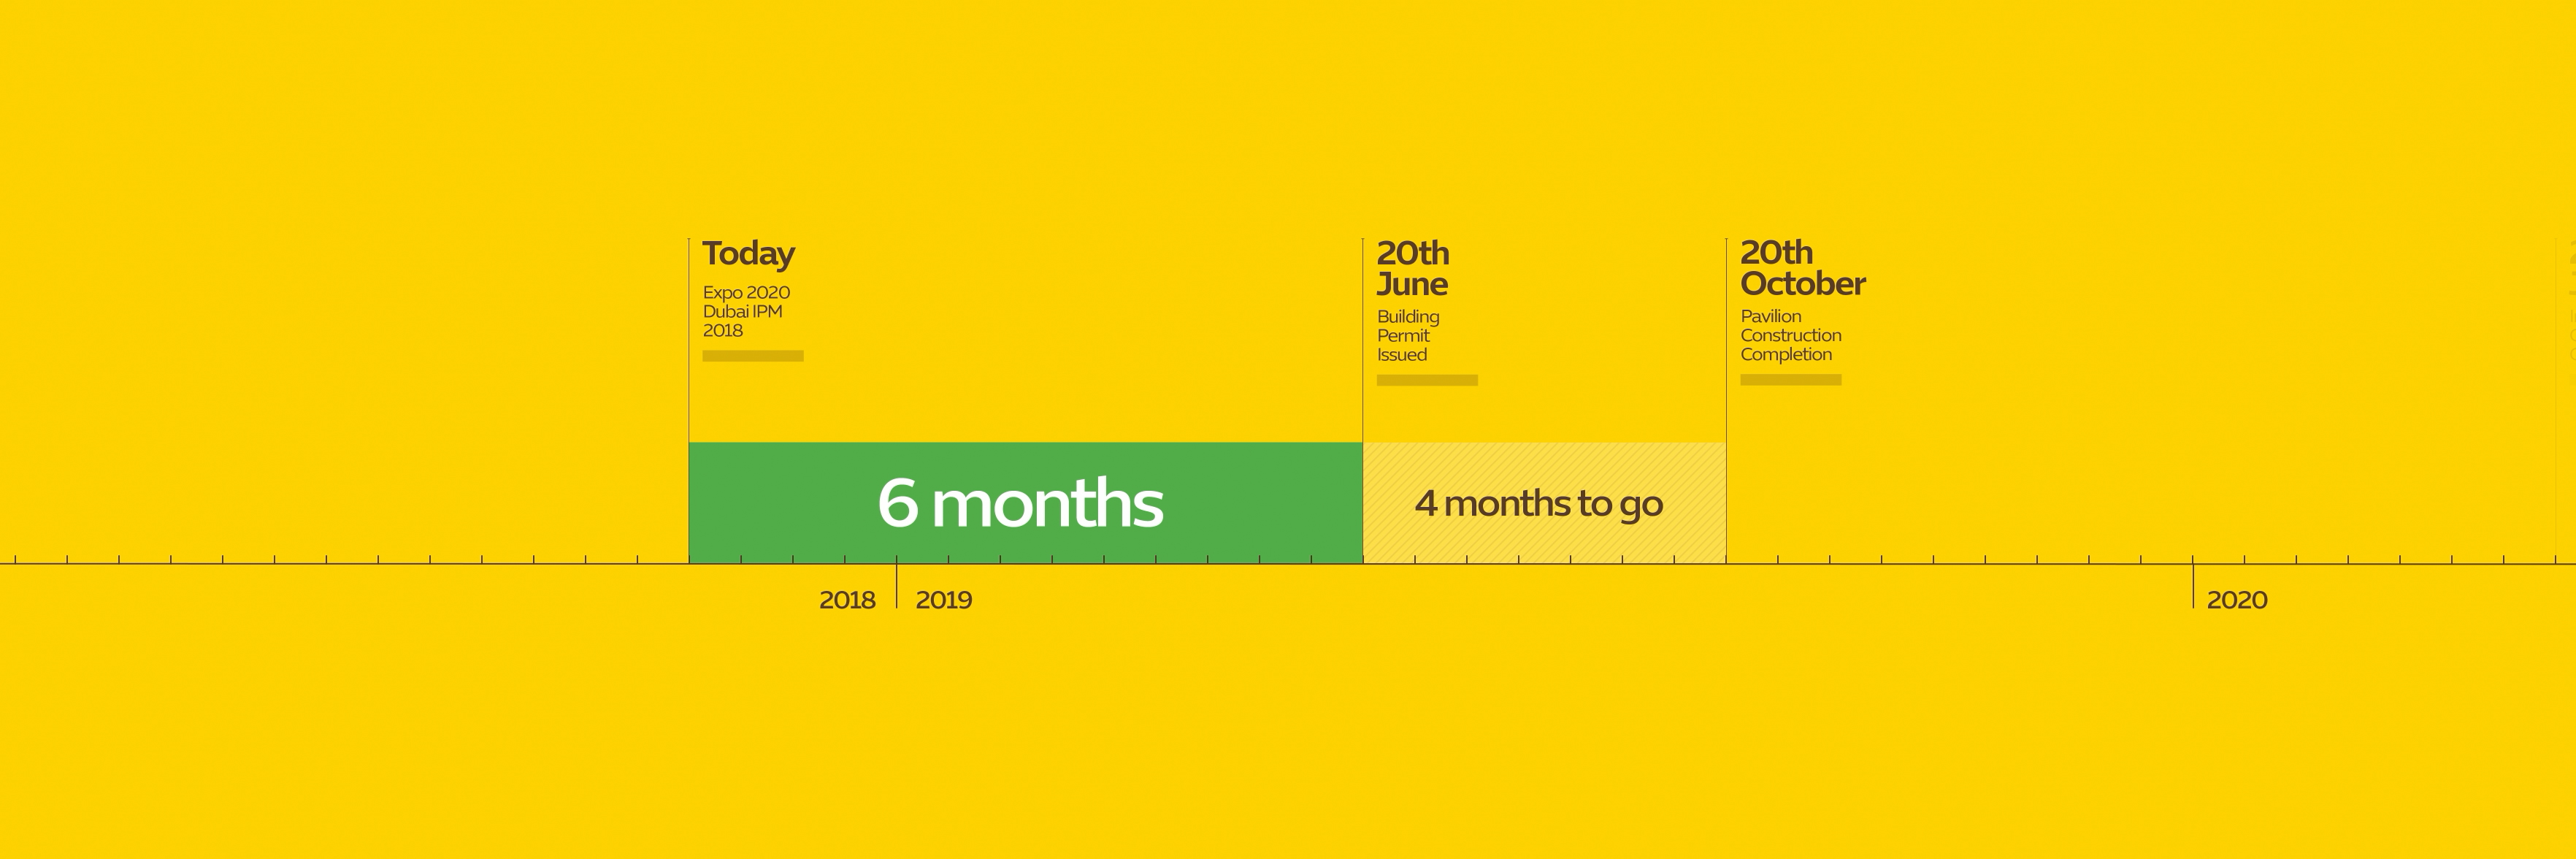
Storytelling
Interactivity
User Experience
Interaction Design
Data Protection
Transparency
Ethical Standards
2D/3D Animation
Print Collaterals
Tools
Excel
Google Sheets
Keynote
After Effects
Photoshop
Illustrator
Powerpoint
Final Cut Pro X
Premiere
DaVinci Resolve
Cinema 4D
Blender
Clients
EXPO 2020
Dubai Tourism
Eco della Stampa
Jabal Omar
AI Trader
NatGeo